| Assumptions |
 What is an assumption?
|
| Assumption | Trend | Composite |
| DistanceToEmploymentCenter | 0.50 miles | 0.50 miles |
| Percent Poverty | 15 percent | 15 percent |
| DistanceToInterchange | 1.50 miles | 1.50 miles |
| DistanceToPark | 0.25 miles | 0.25 miles |
| DistanceToRetail | 0.50 miles | 0.50 miles |
| DistanceToTrail | 0.25 miles | 0.25 miles |
| DistanceToTransit | 0.25 miles | 0.25 miles |
| Low Income | 13,520 $ | 13,520 $ |
| Minority Percent | 24 percent | 24 percent |
| Population | 2.20 | 2.20 |
| StudentsPerHousehold | 1.10 children | 1.10 children |
|
| Indicators |
|
What is an indicator?
|
| Indicator | Trend | Composite |
| EmploymentCenterHousing | 17,600 | 30,000 |
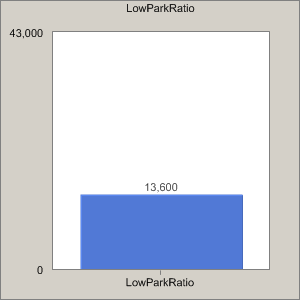
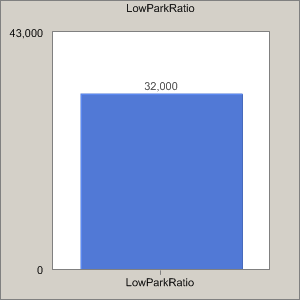
| LowParkRatio | 13,600 | 32,000 |
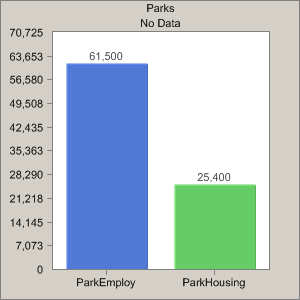
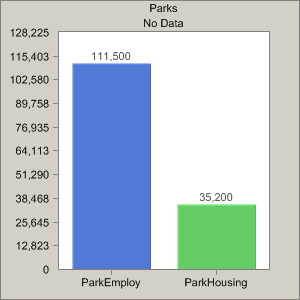
| ParkHousing | 25,400 | 35,200 |
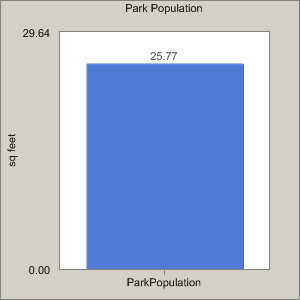
| ParkPopulation | 25.77 sq feet | 25.77 sq feet |
| RetailHousing | 38,600 | 47,000 |
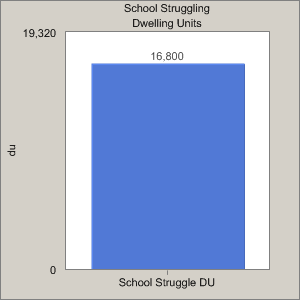
| School Struggle DU | 5,200 du | 16,800 du |
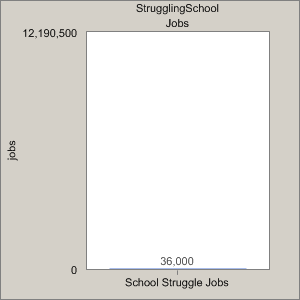
| School Struggle Jobs | 36,000 jobs | 65,500 jobs |
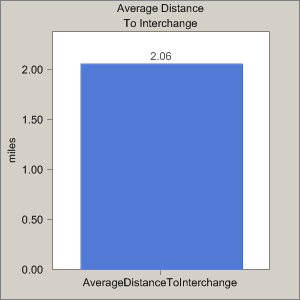
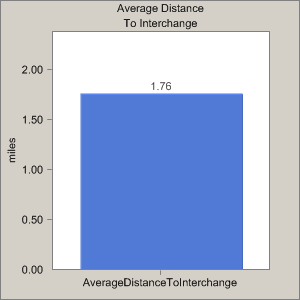
| AverageDistanceToInterchange | 2.06 miles | 1.76 miles |
| Brownfield | 26 | 48 |
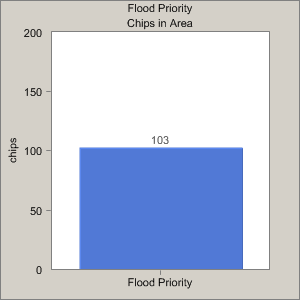
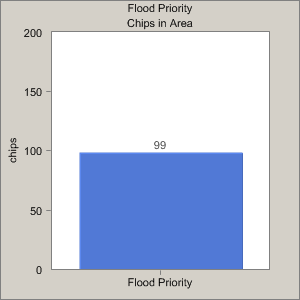
| FloodPriority | 103 | 99 |
| Greenfield | 338 | 294 |
| InterchangeEmploy | 129,000 | 104,500 |
| InterchangeHousing | 19,000 | 26,000 |
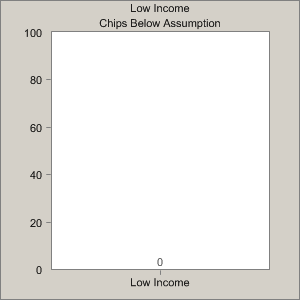
| Low Income | 0 | 0 |
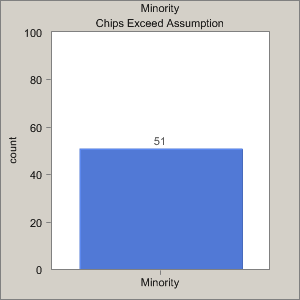
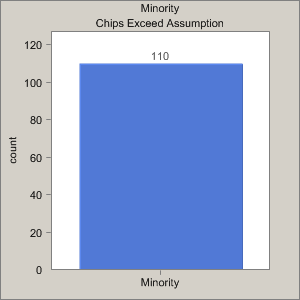
| Minority | 51 count | 110 count |
| ParkEmploy | 61,500 | 111,500 |
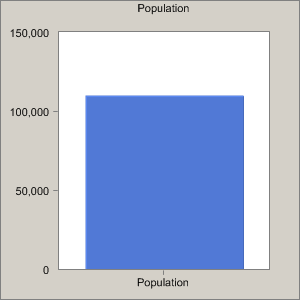
| Population | 110,000.00 | 110,000.00 |
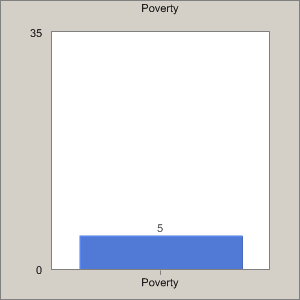
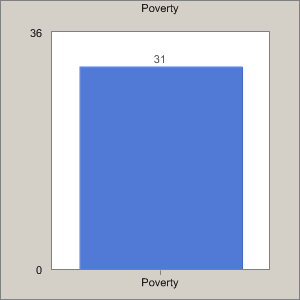
| Poverty | 5 | 31 |
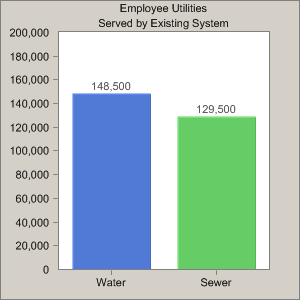
| SewerEmploy | 129,500 | 114,000 |
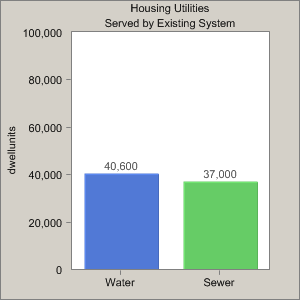
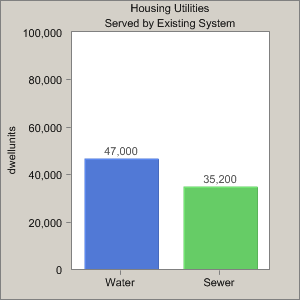
| SewerHousing | 37,000 dwellunits | 35,200 dwellunits |
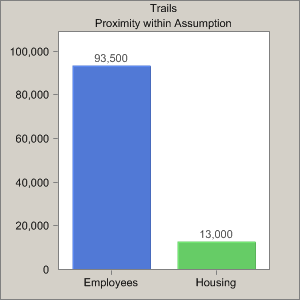
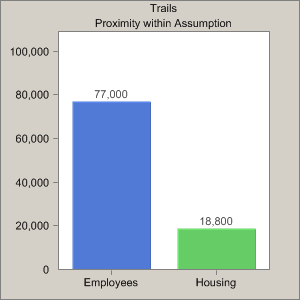
| TrailEmploy | 93,500 | 77,000 |
| TrailHousing | 13,000 | 18,800 |
| TransitEmploy | 5,000 | 26,000 |
| TransitHousing | 1,200 | 7,200 |
| WaterEmploy | 148,500 | 159,500 |
| WaterHousing | 40,600 dwellunits | 47,000 dwellunits |
|